

When I see surveys that show most Millennials aspire to buy a home, I think of Australia. I was a travel marketing reporter once upon a time, and advertising agency reps for that country’s tourism board argued that there was an untapped market of American travelers because Australia was the leading destination on their bucket list, according to a poll. Going to the Land Down Under and snorkeling the Great Barrier Reef certainly is on my list. But my wallet said I would spend another summer week at my in-law’s cabin in the Wisconsin North Woods. A great vacation but goes to show that what consumers say we want to do isn’t what we actually will do.
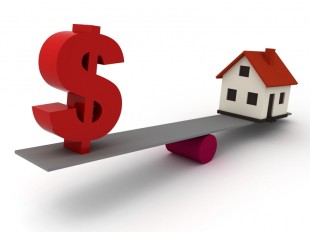
Inevitably, I see press releases and blogs linking the young adults’ preference for home ownership with low interests rates and housing prices. The authors, usually affiliated with the real estate industry, conclude that home ownership is cheap compared with historical averages, and Millennials eventually will come to market. I agree except that many will buy later than their early thirties, the typical age for first-time home buyers. My problem with housing affordability indices is that the metrics make assumptions that cannot be applied to many potential home buyers. There are so many knobs and levers to pull on that apparatus, that these statistics are better at showing movement over time with home prices and income rather than truly measuring “affordability.”
During the superheated climb of housing prices from 2001 to 2007, the National Association of Realtors Housing Affordability Index, the most widely reported such measure in the media, said housing was affordable during every month but one. Were homes affordable based on buyers’ ability to pay the monthly mortgage or was ownership attainable because lending standards were lax? During the subsequent slump, houses were at record levels of “affordability” even though they were out of the reach for many potential buyers because credit was tight.
Another shortfall concerns what it is the indices really measure. The NAR and the National Association of Home Builders use gross median family income and assume there’s a hefty down payment in their calculations. RealtyTrac assumes 10 percent down and uses the median household income, which includes single people. NAR’s and RealtyTrac’s numbers represent how much income is needed to qualify for a mortgage on a median priced home. NAHB’s index compares the share of homes sold in a market that would have been affordable with the area’s median income. Goldman Sachs index may be a little more realistic by measuring how many marginal buyers with lower credit scores can qualify for low down payment mortgages.
According to a 2010 report in the Journal of Financial Counseling and Planning, residual income—what’s left to pay for a house after taxes and all monthly personal expenses are paid—might be a better number to use for calculating affordability. That figure takes household size into account (families have more expenses than single people) and better reveals borrowers’ ability to sustain monthly mortgage payments. Some indices are not meaningful taken alone. Industry watchers probably would do better to somehow mash multiple measures together. Either we’ll get a better read on affordability or become even more confused.